


High-Performance Sales Analytics
Engine for Jindal Aluminium
Client Introduction
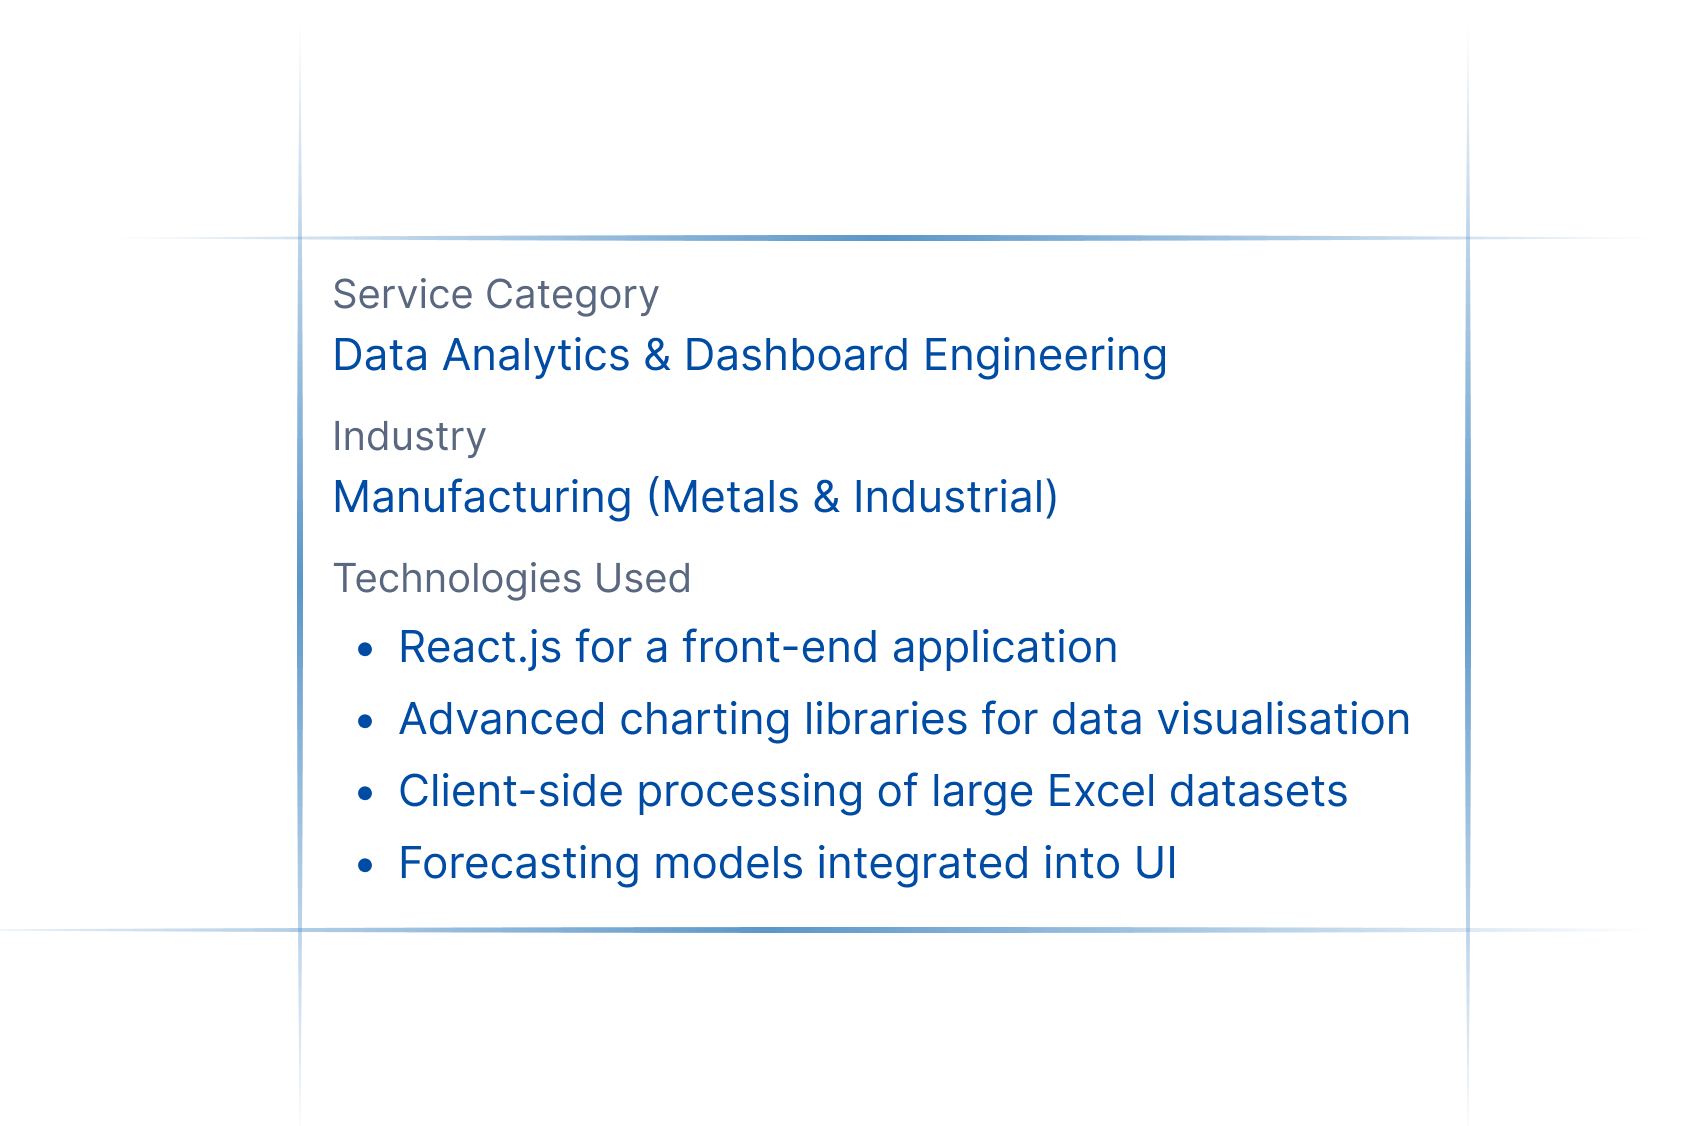
Jindal Aluminium is one of India’s largest manufacturers of aluminium extrusions and flat-rolled products. With a wide national distribution network, diverse product lines, and high-volume sales operations, the company handles extensive transactional datasets across zones, customer groups, and material categories. To improve strategic planning and operational visibility, Jindal Aluminium needed an efficient way to analyse its growing sales data.
Business Requirements
Jindal Aluminium relied heavily on large Excel files to track sales performance. The leadership team needed a faster, more intuitive way to analyse trends across zones, customers, materials, and sales executives.
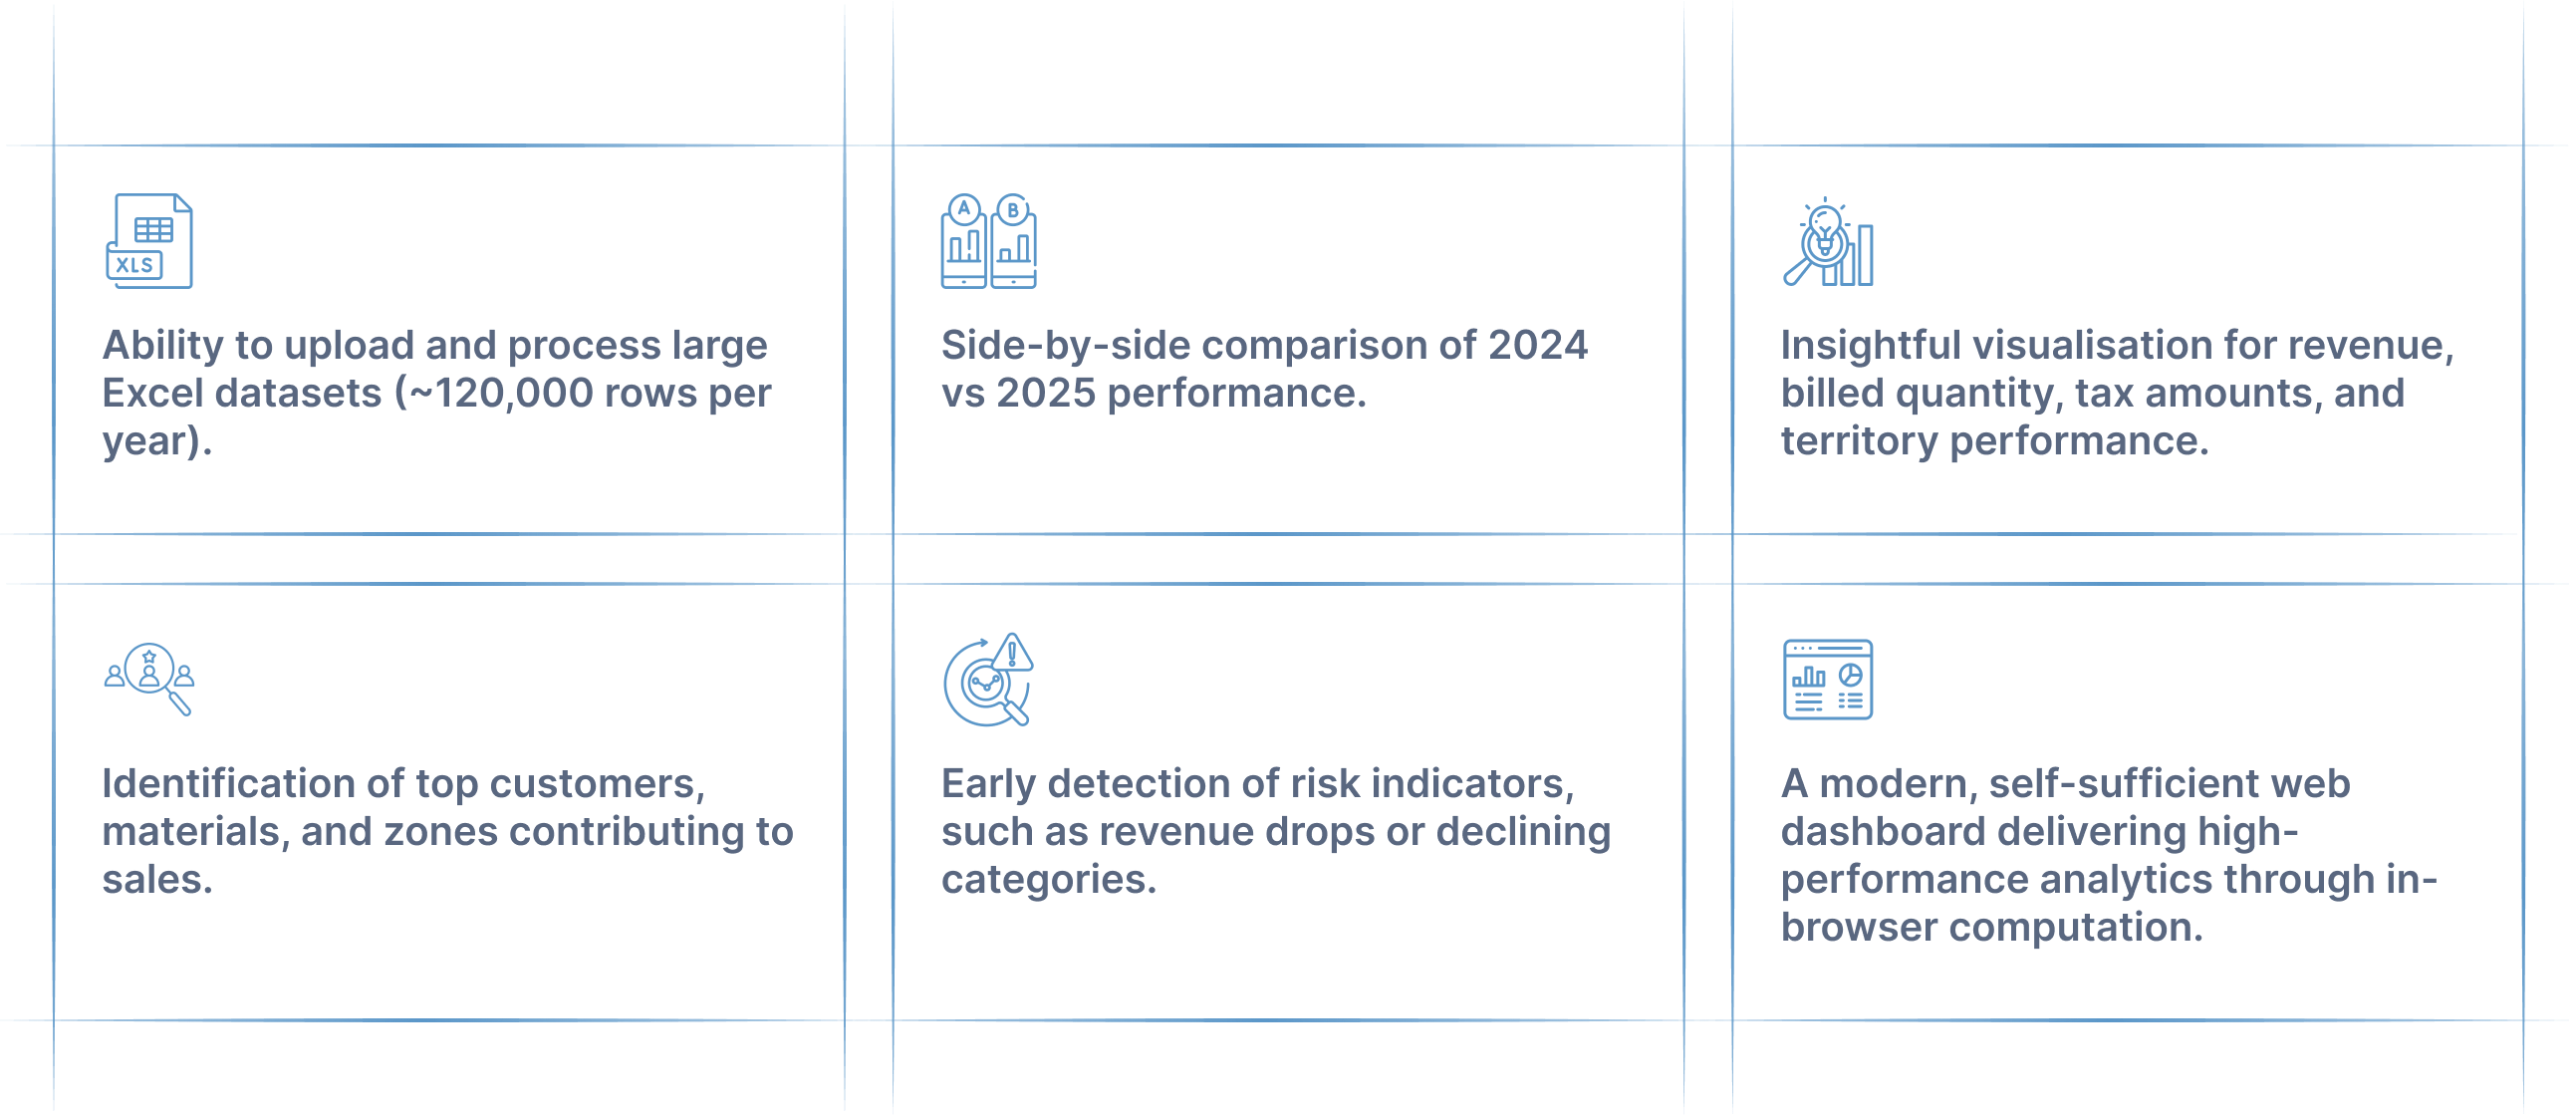

Ability to upload and process large Excel datasets (~120,000 rows per year).

Side-by-side comparison of 2024 vs 2025 performance.

Insightful visualisation for revenue, billed quantity, tax amounts, and territory performance.

Identification of top customers, materials, and zones contributing to sales.

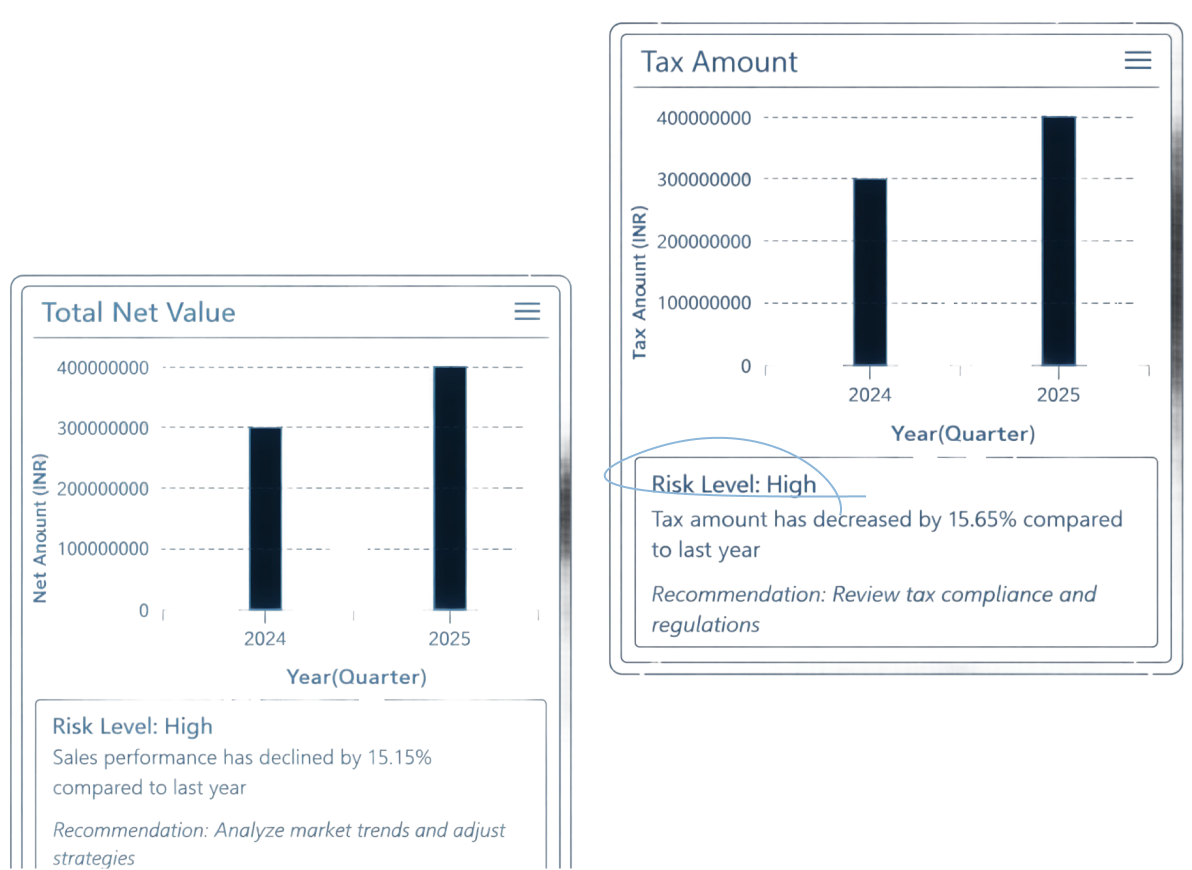
Early detection of risk indicators, such as revenue drops or declining categories.

A modern, self-sufficient web dashboard delivering high-performance analytics through in-browser computation.
Solution Delivered by Cloudesign
Cloudesign delivered a high-performance, enterprise-grade Sales Insights Dashboard designed to seamlessly analyze over 240,000+ records with exceptional speed and accuracy. The solution was engineered to provide a fluid, executive-ready analytics experience focused on clarity, scalability, and real-time decision support.
Advanced Frontend Engineering with React
A modern, responsive interface was built using React.js, enabling seamless navigation, dynamic filtering, and interactive visual exploration of large-scale sales data.
.webp)
High-Efficiency Data Processing Engine
The platform leverages optimized in-browser computation to deliver real-time analytics and instant insights across the complete dataset.
End-to-End Sales Analytics Framework
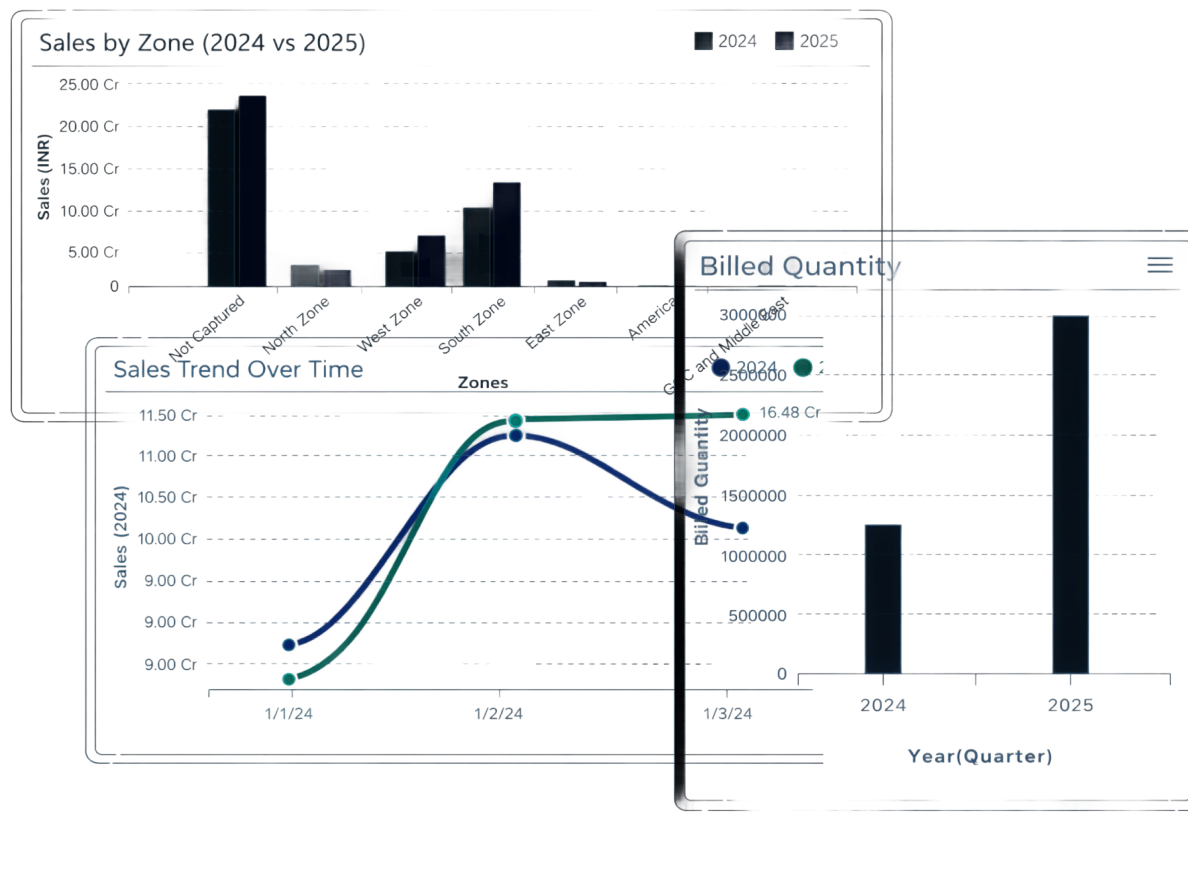
The dashboard provides a comprehensive analytical view
including:
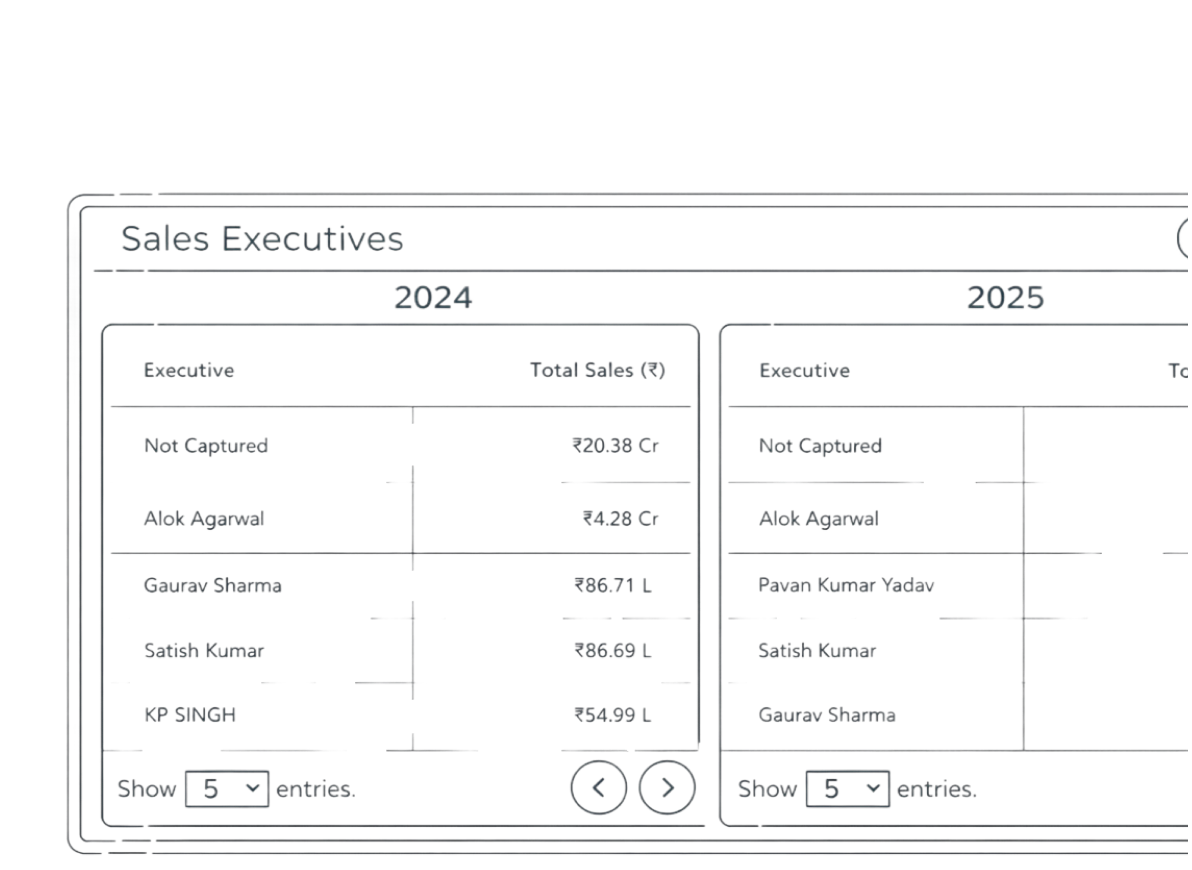
- Year-over-year performance comparison (2024 vs 2025)
- Revenue, billed quantity, tax, and sales trend analysis
- Zone-wise and sales executive-wise performance tracking
- Customer-wise revenue composition through interactive
tree maps - Material group–level contribution analysis
- Monthly and quarterly performance trend dashboards
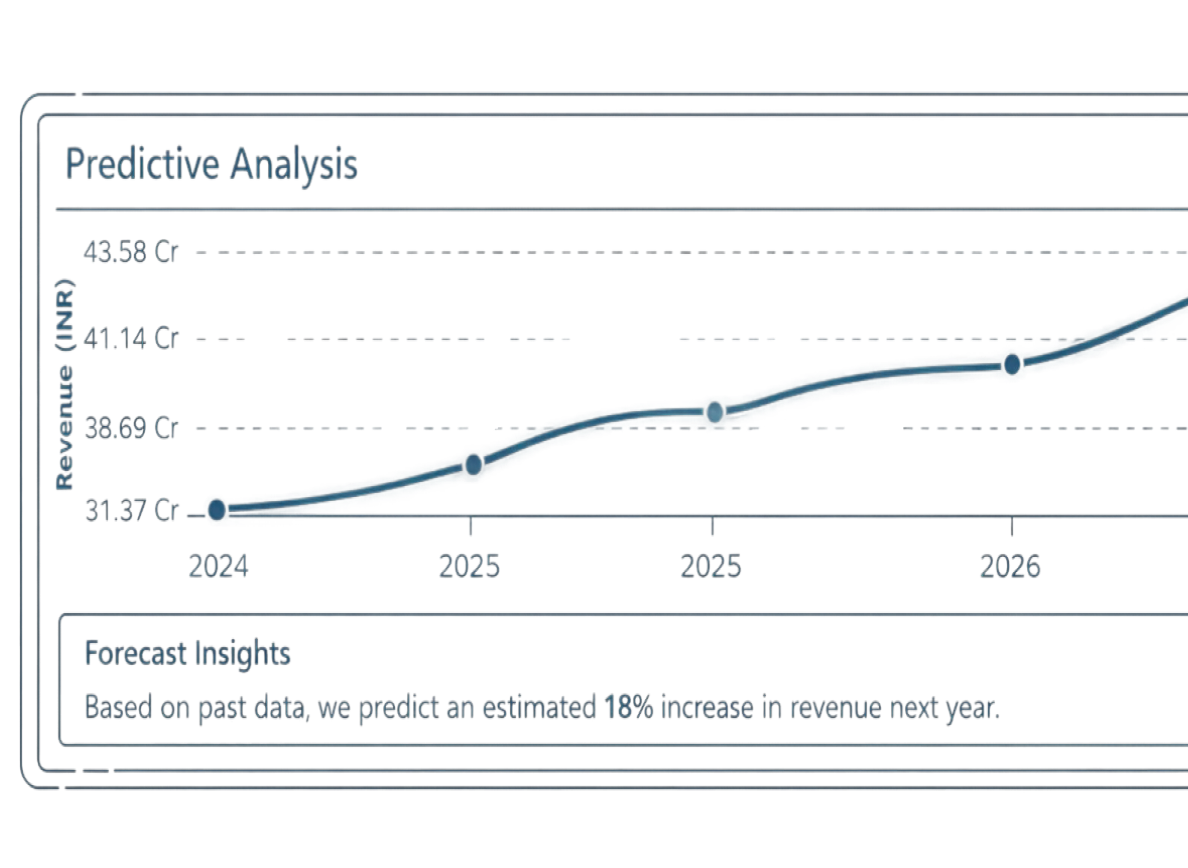
Intelligent Forecasting Module
An integrated forecasting engine projected an estimated 18% revenue growth for 2026, enabling leadership to proactively plan demand and capacity.
Proactive Risk & Anomaly Detection
Smart indicators automatically flagged high-risk and attention-required segments, helping stakeholders act early on revenue declines or unusual patterns.
Business Benefits

Accelerated Decision-Making at Scale
Leadership transitioned from static manual analysis to real-time interactive intelligence, enabling decisions to be made up to 4X faster.

Unified Visibility Across the Sales Ecosystem
Stakeholders gained a single, comprehensive view of performance across zones, customers, sales executives, and material categories.

Stronger Strategic & Forecast-Driven Planning
Advanced trend and forecasting insights empowered leadership to shape production, capacity, and sales strategies for 2026 with confidence.

Proactive Risk Identification
Automated detection of revenue drops, category slowdowns, and underperforming territories enabled early corrective action.

Optimised Cost & Operational Efficiency
The solution delivered enterprise-grade analytics with minimal operational overhead, ensuring faster deployment and lower long-term ownership costs.

Enterprise-Wide Data Accessibility
Intuitive visualisation and user-friendly dashboards enabled non-technical teams to independently interpret insights, significantly improving data-driven culture across the organisation.

Let's Shape Your Vision Together!
Ready to discuss your next digital transformation project? Our experts are here to help you plan, design, and engineer solutions built for scale and performance.
What Happens Next?
Consultation
Share your idea, and our team will schedule a discovery call to understand your goals and challenges.
Solution Blueprint
Receive a tailored technology roadmap outlining architecture, tools, and timelines to bring your vision to life.
Onboarding
Once aligned, our engineers integrate seamlessly with your team to execute and accelerate delivery.
Send us an email at
sales@cloudesign.com