Data visualization and analytics background

Enterprise AI-Driven Data Visualization
Platform For Strategic Decision-Making

Turn data into predictive narratives with Cloudesign's AI-powered visualizations.

Drive Executive Action with AI-
Powered Prescriptive Data Analytics

Cloudesign acts as a premier data visualization company, bridging the gap between massive data warehousing repositories and executive action. By integrating AI-driven pattern recognition, we ensure your data analytics are not just descriptive but prescriptive, allowing you to anticipate shifts before they happen.

72

Hours Talent Onboarding

3%

Top Data Engineers

Case Study: Data Visualization Transformation with Power BI for
Enterprise Reporting

Case Study

Case Study

Enabling real-time business visibility by implementing centralized Power BI dashboards integrated with enterprise data systems.

A multi-entity retail and distribution organization managing sales, inventory, and financial reporting across regional branches with fragmented reporting systems.


The ProblemWhat We Built / DeliveredImpact / Result
  • The organization relied heavily on manual Excel-based reports for operational and financial analysis, which delayed the availability of insights needed for timely decision-making.
  • Data existed across multiple disconnected systems, leading to inconsistent KPIs and differences in reporting across departments.
  • Leadership teams lacked real-time visibility into sales, inventory, and financial performance across regional branches.

Core Services in Data Visualization

Cloudesign's data visualization services provide six core pillars to transform complex data into actionable strategic assets.

Embedded Analytics & Custom
Integration

Increase your application's value by integrating powerful data visualization solutions directly into your existing software. We develop custom, embeddable visual elements that allow users to access business analytics consulting insights without ever leaving their primary workflow environment.

Value Cloudesign Brings to Your Business

We don't just build charts; we help you see your business more clearly. Our goal is to make your data easy to use so you can make better choices every day.

Faster Decisions

Faster Decisions

We help you stop wasting time on manual reports. By setting up automated systems, we get the right information to your screen instantly, so you can act while the data is still fresh.

Built for all

Built for all

You don't need to be a tech expert to understand our dashboards. We design everything to be simple and clear, so anyone on your team can find the answers they need.

One Clear Picture

One Clear Picture

Sometimes different departments have different numbers. We bring all your data together into one place. This ensures everyone is looking at the same facts, which stops confusion and keeps the team on the same page.

Ready for the Future

Ready for the Future

As your business grows, your data grows too. Our systems are built to handle more information without slowing down. Plus, we use smart AI tools that can help you predict what might happen next.

Better Data Quality

Better Data Quality

Bad data leads to bad choices. We clean and rigorously check your information before it ever hits a dashboard. You can trust that the numbers you see are consistently accurate and up-to-date.

Solving Real Problems

Solving Real Problems

We focus on the metrics that actually matter for your growth. Whether it's tracking sales, managing stock, or understanding customers, we build tools that helps to solve business challenges.

How Cloudesign Implements AI in Data Visualization?

We transcend traditional BI by embedding Generative AI and Machine Learning into your visual ecosystem, transforming dashboards from static displays into proactive decision-making partners:

We leverage Large Language Models (LLMs) to provide instant narrative summaries of your data. Instead of just seeing a chart, your Data visualization platform explains the "why" behind the numbers, delivering automated executive summaries that highlight critical shifts and correlations.

Through AI-powered "Copilots" and Natural Language Processing, we enable users to interact with their Power BI or custom dashboards using plain language. This democratizes data analytics, allowing any team member to generate complex reports and visual insights simply by asking a question.

We utilize AI to optimize Dashboard design and layout. By analyzing user interaction patterns, the system automatically suggests the most effective visualization types (e.g., changing a bar chart to a heat map) to ensure maximum cognitive clarity and faster insight retrieval.

We integrate machine learning models to move your KPI dashboards beyond historical data. Our implementation includes predictive trend lines and prescriptive "what-if" simulations, allowing you to visualize future scenarios and determine the best path for performance monitoring.

Our AI-driven ETL processes automatically detect data inconsistencies and suggest corrections. This intelligent Data quality management ensures that your visualizations are always built on a "single source of truth," significantly reducing manual data prep time.

We deploy AI algorithms that monitor your Real-time dashboards 24/7. The system proactively alerts stakeholders to unusual patterns or data outliers that human analysts might miss, facilitating immediate intervention in critical areas like Supply chain analytics or fraud detection.

Why Top Companies Choose Cloudesign for Data Visualization?

Top enterprises partner with Cloudesign because we bridge the gap between complex data engineering and intuitive business strategy.

Elite Partnerships & Expertise

Elite Partnerships & Expertise

As an Azure Data & AI Solution Partner and Databricks partner, we bring certified expertise to every BI transformation project.

Proven Track Record

Proven Track Record

With over 10 years of experience, we have successfully deployed 350+ custom dashboards that drive measurable ROI across diverse industries.

Scalable Staff Augmentation

Scalable Staff Augmentation

We offer flexible staff augmentation models, providing you with on-demand access to elite data visualization consulting experts and Power BI specialists to scale your internal teams instantly.

Focus on Data Integrity

Focus on Data Integrity

We prioritize data quality management to ensure your KPI dashboards are built on a "single source of truth," eliminating departmental silos and inconsistent reporting.

End-to-End Solutions

End-to-End Solutions

From architecting data warehousing to fine-tuning interactive dashboards, we handle the entire lifecycle of your data analytics journey.

Cost-Effective Innovation

Cost-Effective Innovation

By leveraging a mix of enterprise tools like Power BI and cost-efficient open-source frameworks, we deliver high-performance data visualization solutions that fit your budget.

Tools & Frameworks

Cloudesign's Implementation Strategy

Power BI
Tableau
Qlik
ThoughtSpot

Cloudesign's Implementation Strategy

We lead BI transformation by implementing self-service reporting and persona-specific KPI dashboards that drive data-driven decisions. By integrating automated data storytelling features, we translate complex datasets into actionable executive summaries that highlight growth opportunities and operational risks.

Scale Your Insights with Targeted Data Visualization Staff Aug

Don’t let technical bottlenecks or a lack of design expertise delay your go-to-market strategy. We provide high-performing BI Developers and AI Experts to turn complex datasets into actionable executive dashboards.

Helpful Reads and Common Inquiries

Read our newest articles for the latest trends and browse our FAQ for everything you need to know.

Explore our most recent blog posts and industry updates

No blogs found for this category.

Find quick answers about our data visualization services.

A data visualization platform is an integrated software solution that connects to multiple data sources, processes information through ETL processes and data warehousing, and presents insights via interactive dashboards and visual analytics. ETL processes are crucial as they clean, transform, and load data into the platform, ensuring the visualizations are accurate and timely.

Data visualization focuses specifically on presenting data through visual formats, while business intelligence services (BI services) encompass the entire process of collecting, integrating, analyzing, and presenting data. BI services include data warehousing, ETL processes, data quality management, and data visualization as components of a comprehensive strategy.

Data visualization services accelerate data-driven decisions by reducing reporting time by up to 85%, improving operational efficiency through real-time dashboards and performance monitoring, and increasing data accessibility. Interactive dashboards
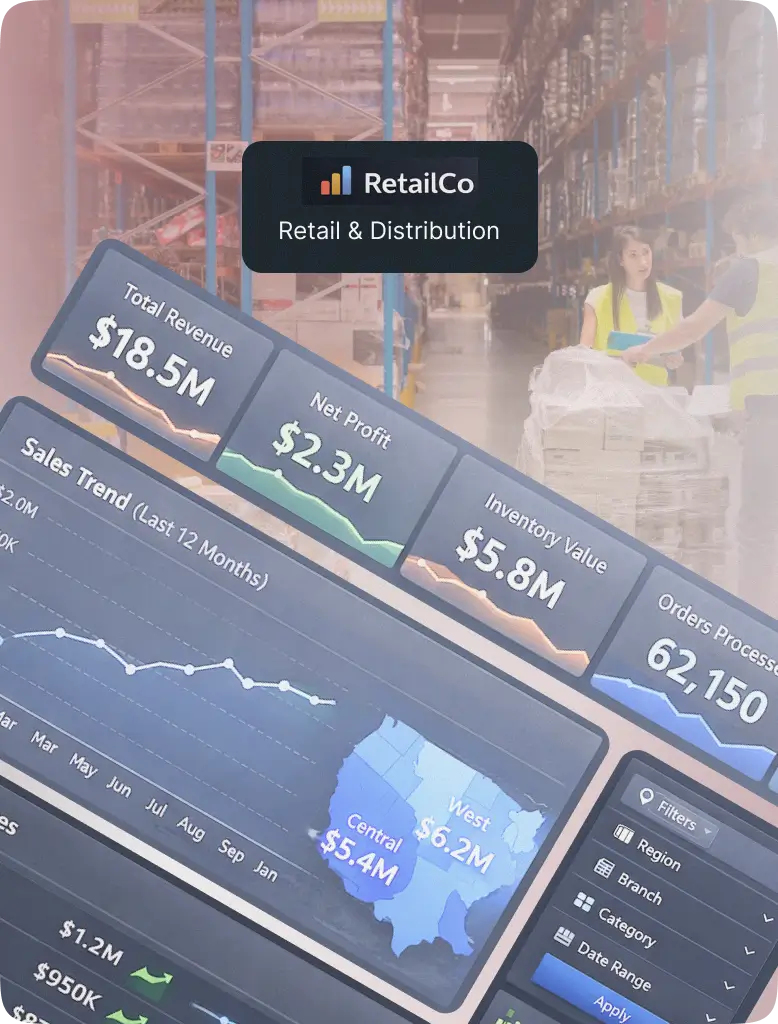
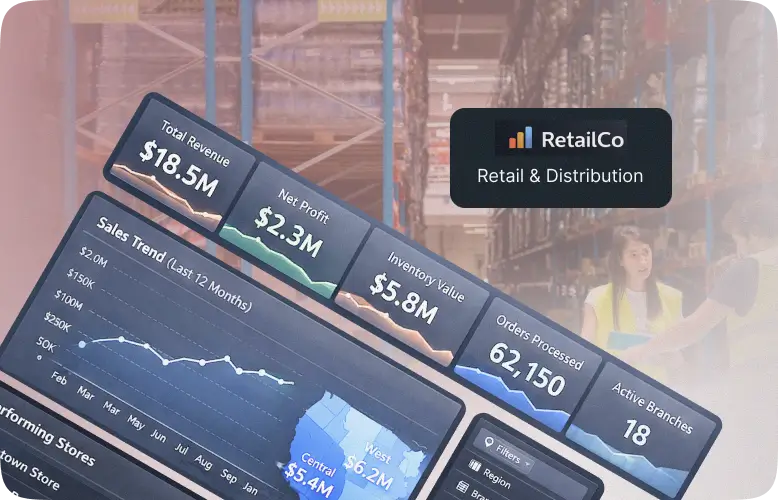
 and KPI dashboards provide instant pattern recognition and visibility into critical metrics.

Data quality management is integrated throughout our visualization process via automated validation rules, data profiling during ETL processes, anomaly detection algorithms, and continuous monitoring. We implement data quality management frameworks ensuring accuracy, consistency, and compliance across all custom dashboards and reports within the data visualization platform.

For Supply Chain Analytics, critical custom dashboards include KPI dashboards for inventory levels, logistics performance, and demand forecasting. For Customer Analytics, dashboards focus on behavior tracking, segmentation, sales performance, and lifetime value, enabling proactive data-driven decisions.

Data visualization tools are software applications like Power BI, Tableau, and Looker that transform raw data into visual representations. In Financial Data Visualization, these tools are used to create specific custom dashboards for risk assessment, portfolio performance, regulatory reporting, and detailed financial data visualization analysis.

Choosing a specialized data visualization company ensures deep expertise in dashboard development, BI transformation, and data visualization strategy that generalist analytics consulting firms may lack. This specialization is key to achieving optimal user adoption, sub-second performance, and measurable ROI from your data visualization platform.

A strong data visualization strategy incorporates real-time dashboards by identifying time-critical metrics (e.g., machine performance, transaction flows) and architecting the supporting infrastructure, including high-speed data warehousing and streaming ETL processes, to ensure performance monitoring is instant and reliable.

Data warehousing is crucial because it acts as the centralized, optimized repository for cleansed and structured data. It aggregates historical and operational data, enabling interactive dashboards to execute complex queries quickly (low-latency) and consistently, ensuring accurate data analytics across the enterprise.

Yes. Cloudesign delivers domain-specific data visualization solutions and business analytics consulting services, including specialized visualizations for Healthcare Data Analytics. These focus on areas like patient outcomes, clinical decision support, operational efficiency, and regulatory compliance reporting using tailored custom dashboards.

lets-collaboratelets-collaborate

Let's Shape Your Vision Together!


Ready to discuss your next digital transformation project? Our experts are here to help you plan, design, and engineer solutions built for scale and performance.

What Happens Next?

1

Consultation

Share your idea, and our team will schedule a discovery call to understand your goals and challenges.

2

Solution Blueprint

Receive a tailored technology roadmap outlining architecture, tools, and timelines to bring your vision to life.

3

Onboarding

Once aligned, our engineers integrate seamlessly with your team to execute and accelerate delivery.

Send us an email at

sales@cloudesign.com

Let’s Discuss Your Project


Phone
chatBox

Talk to Us

logo
Affiliate Brands
company
company
company

Follow

social-iconsocial-iconsocial-iconsocial-icon

Services

Resources

Contact Us

Bangalore:

BDA Complex, 7th Cross, 16 B Main, B Block, Koramangala, Bengaluru, 560034

Mumbai:

Ajmera Sikova, 606, Ghatkopar West, Mumbai, Maharashtra 400086

© 2025 Cloudesign Technology Pvt Ltd. All Rights Reserved